Variance Tracking Across Disciplines: Outlier Metrics in Basketball Assists and Racing Pace Figures Reshape Accumulator Construction
Wendy Krause · Jul 30, 2026

Variance Tracking Across Disciplines: Outlier Metrics in Basketball Assists and Racing Pace Figures Reshape Accumulator Construction
Cross-sport variance tracking has gained traction among data analysts who examine how outlier performances in basketball assists and thoroughbred racing pace metrics alter the structure of accumulator bets, which combine multiple selections into single wagers with multiplied odds. Observers note that these metrics often deviate from established averages during specific periods, creating opportunities for refined bet construction when integrated across different sports.
Understanding Assist Outliers in Basketball
Basketball assist figures represent passes that directly lead to scoring plays, and outliers emerge when individual players exceed seasonal norms by substantial margins. Research from sports analytics groups shows these spikes frequently occur in games featuring high-tempo offenses or when teams face defensive schemes that leave perimeter shooters open. Data indicates that assists per game can fluctuate by 20 to 30 percent above player baselines during conference tournaments, a pattern documented across multiple seasons ending in July 2026.
Those who study professional leagues track these deviations through standardized z-scores, which measure how far a performance strays from the mean. When an assist outlier coincides with favorable team matchups, it influences accumulator builders to include related player props or team totals rather than relying solely on traditional win selections. This adjustment accounts for variance that standard models sometimes overlook.
Pace Deviations in Racing Contexts
In thoroughbred racing, pace figures quantify early speed and sectional times, with outliers appearing when horses run faster or slower than their established patterns. Analysts compile these from official timing data, noting that pace anomalies often precede strong finishes in subsequent starts. Evidence from racing authorities in Australia and Canada reveals that horses posting pace outliers in sprints tend to carry that momentum into longer distances, particularly on tracks with consistent rail positions.
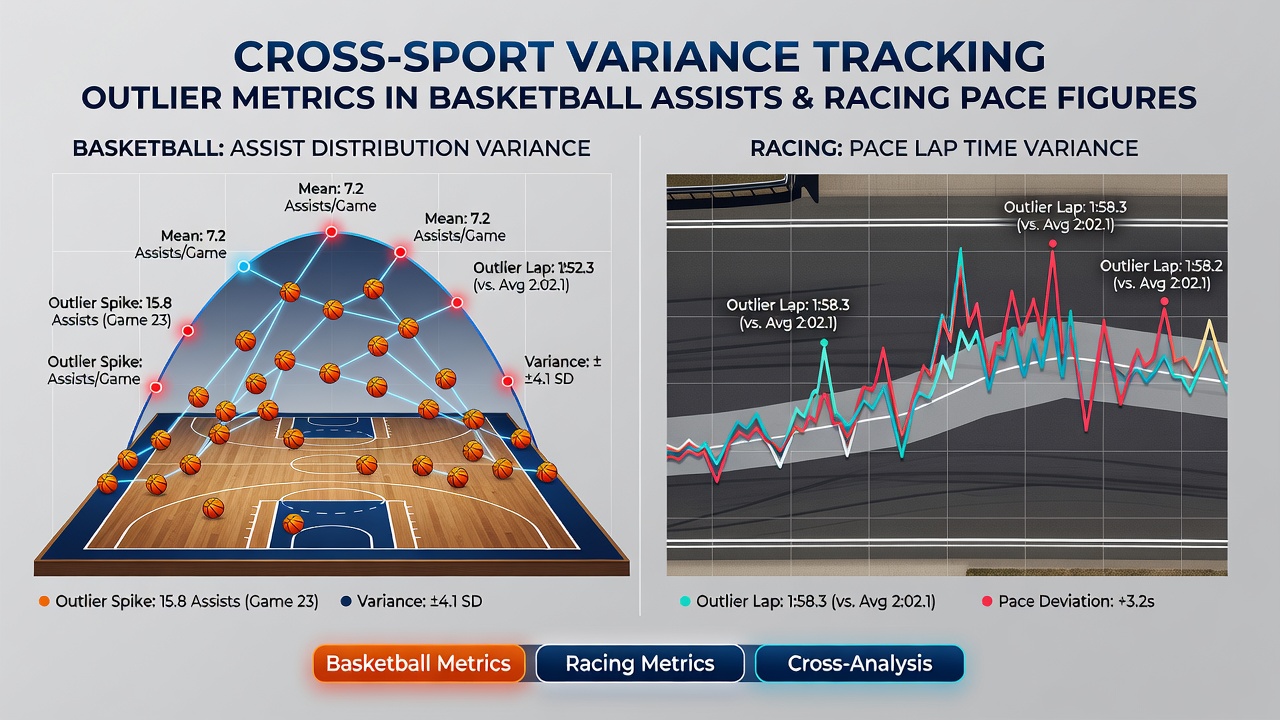
Accumulator constructors incorporate these pace metrics by adjusting odds on horses that demonstrated extreme early fractions, since such runs can signal either burnout or readiness for improved positioning. Studies from university sports science departments highlight correlations between pace variance and finishing positions that exceed random expectation, prompting bettors to layer racing selections with basketball props in multi-leg accumulators.
Integration into Accumulator Strategies
Accumulator construction benefits when variance data from both disciplines feeds into unified models. Researchers at institutions tracking global betting patterns observe that combining an assist outlier with a racing pace deviation produces higher implied probabilities than isolated selections, though actual outcomes depend on external factors such as weather or injury reports. Figures from industry reports confirm that variance-adjusted accumulators show measurable shifts in payout distributions during peak summer racing and basketball seasons.
Take one dataset compiled through July 2026, where analysts paired basketball teams with elevated assist rates against racing events featuring pace leaders. The resulting structures often featured four or five legs rather than traditional seven-leg combinations, concentrating risk on verified outliers. This approach draws from sources including academic papers on performance modeling and reports issued by regional gaming associations in North America and Europe.
Data Sources and Measurement Techniques
Measurement relies on standardized databases that aggregate play-by-play logs and timing chips. According to findings published by sports research centers, z-score thresholds above 2.0 flag meaningful outliers in both assists and pace. These thresholds help distinguish noise from actionable signals when constructing accumulators that span basketball and racing events. External validation comes from organizations such as the Australian Gaming Council, which publishes periodic summaries on cross-market wagering trends.
Another reference point appears in studies from Canadian university programs examining athletic performance variance, where similar statistical filters apply to endurance and skill-based metrics. The resulting data feeds software tools that simulate accumulator outcomes under varied outlier scenarios, producing probability matrices used by professional syndicates.
Conclusion
Variance tracking across basketball assists and racing pace continues to inform accumulator construction by highlighting performances that diverge from established norms. Data from multiple regions demonstrates consistent patterns that analysts integrate into multi-sport selections, with measurement techniques refined through ongoing academic and industry collaboration. As datasets expand through 2026 and beyond, these methods provide structured ways to account for performance deviations in combined wagering formats.